 at the top. Below is an example fishbone diagram, dissected into cause and effect sections to find the root cause of a problem. On a white background.")
The Fishbone Diagram, also known as the Ishikawa Diagram or Cause and Effect Diagram, is a visual tool used for root cause analysis. It helps teams systematically identify potential causes of a problem, categorising them to pinpoint the root causes.
Developed by Kaoru Ishikawa in the 1960s, it was initially used to control quality in manufacturing processes. The diagram resembles a fish's skeleton, with the problem or effect at the head and potential causes extending as "bones" along the spine.
Who is Ishikawa?
Kaoru Ishikawa (1915–1989) was a prominent Japanese organisational theorist and professor in the field of quality management. He is best known for developing the Fishbone Diagram. Ishikawa's contributions to quality management extended beyond this diagram; he also played a key role in the development of Total Quality Management (TQM) philosophy.
Ishikawa believed that quality improvement could be best achieved by breaking down silos and encouraging cross-functional team collaboration. He advocated for the simplification of quality control for the broader involvement of workers and stressed the importance of a company-wide approach to quality. Ishikawa's work has had a lasting impact on quality management practices worldwide, making him one of the key figures in the field.
This tool has since been widely adopted across various industries for problem-solving and quality improvement, owing to its simplicity and effectiveness in breaking down complex issues into manageable parts.
What is a Fishbone Diagram?
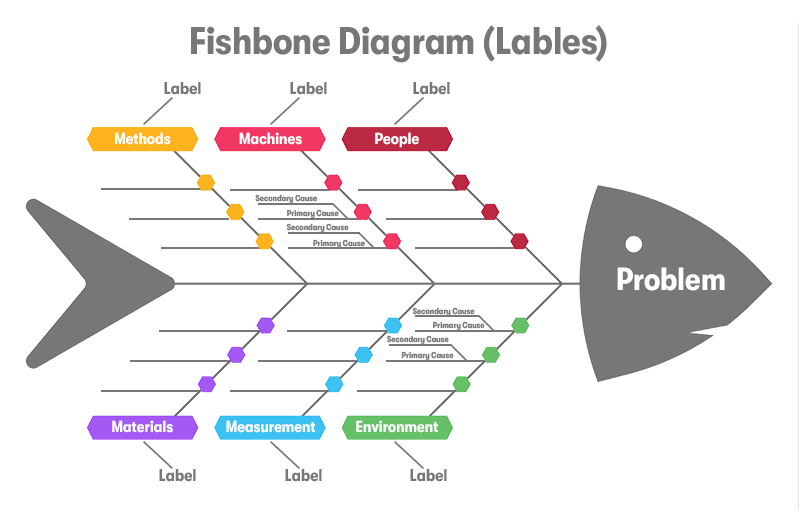
A Fishbone Diagram, also known as an Ishikawa diagram or a cause-and-effect diagram, is a visual tool used for systematic problem-solving and root cause analysis. It helps teams categorise and visualise the different potential causes of a problem to identify its root causes. The diagram looks like a fish's skeleton, hence the name fishbone diagram.
The diagram starts with the problem statement or effect at the head and the bones representing categories of potential causes that branch out. The major categories often include People, Methods, Machines, Materials, Measurements, and Environment, but they can be customised based on the specific situation or industry.
This tool encourages team brainstorming and is widely used in quality management, especially in the fields of manufacturing, marketing, and project management. By identifying underlying issues, teams can develop targeted strategies to address them, leading to more effective problem-solving and process improvement.
How to make a Fishbone Diagram of cause and effect?

Creating a Fishbone Diagram involves several steps. This tool is used for identifying root causes of a problem by organising potential causes into categories. Here's is a step-by-step guide on how to create one:
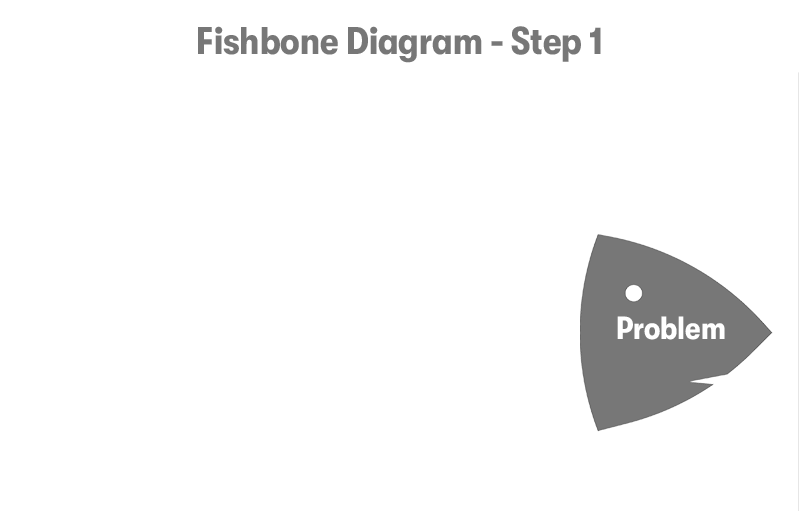
Step 1: Identify the Problem
Begin by clearly stating the problem or effect you're analysing. This is written at the head of the fish, usually on the right side of your diagram. Be specific about the problem to ensure an effective analysis.
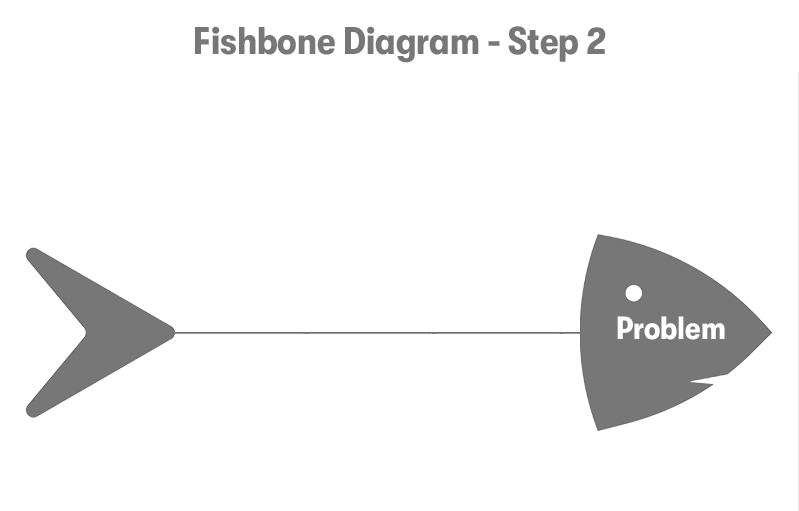
Step 2: Draw the Backbone
Draw a straight line from the left side of the page (the tail), leading towards the problem statement on the right. This line represents the "backbone" of the fish.
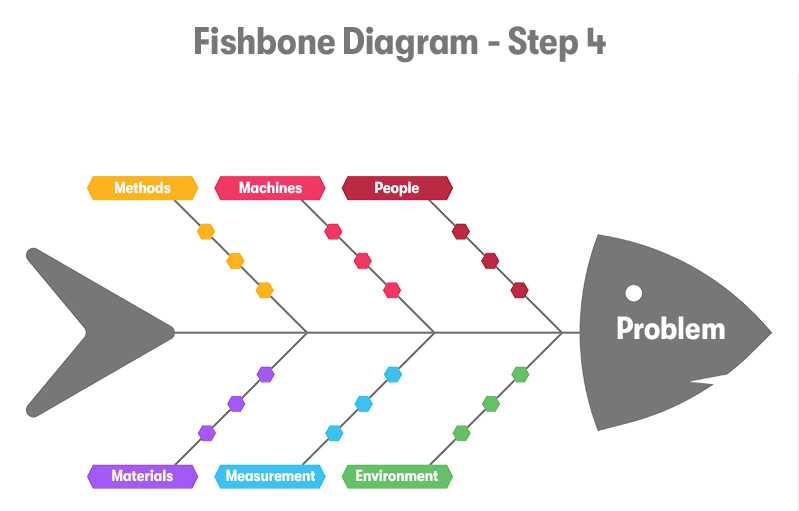
Step 3: Determine Cause Categories
Decide on the major categories of causes that may contribute to the problem. Common categories include Methods, Machines (equipment), People (manpower), Materials, Measurement, and Environment, but these can vary based on the specific context or industry. Another common category is the 4 dimensions from ITIL4 which are; Products, Processes, People, and Partners. These categories will form the "ribs" of the fish.
Step 4: Draw the Cause Branches
Draw lines slanting outward from the backbone to create branches for each category. These branches should resemble fish bones.
Step 5: Brainstorm Sub-Causes
Under each category, brainstorm potential causes that may contribute to the problem. Add these as smaller branches stemming from each category branch. Encourage team participation for a comprehensive analysis.

Step 6: Analyse and Prioritise Causes
Once all potential causes have been laid out, discuss and analyse them to identify the most likely root causes. Tools like the 5 Whys analysis can be helpful in digging deeper into each cause.
Step 7: Take Action
After identifying the root causes, the next step is to develop action plans to address these issues to prevent the problem from occurring again.
Step 8: Review and Update
The Fishbone Diagram can be a living document. As you implement solutions and learn more about the problem, update the diagram to reflect new insights or root causes.
Fishbone Diagrams are best created collaboratively with all stakeholders involved in the process. This ensures a comprehensive view of the problem and leverages the collective knowledge and perspective of the team. Using whiteboards or specialised software can facilitate the drawing and discussion process.
How to Label or categorise Fishbone Analysis?
Deciding on the categories for a Fishbone Analysis is crucial as it structures the brainstorming process and helps in systematically identifying potential causes of the problem. The categories you choose should cover all possible aspects of the problem, ensuring a comprehensive analysis. Here are steps and considerations for deciding on categories:
Understand the Problem Context
Before choosing categories, have a clear understanding of the problem you're analysing. Different problems may require different categories for a thorough analysis.
Customise Categories for Your Needs
Depending on your specific problem or industry, you may need to customise or add categories. For example, in service industries, "Procedures" and "Policies" might be more relevant categories, while in software development, "Software" and "Hardware" could be key categories.
Engage the Team
Involve people from different roles related to the problem. Team brainstorming can uncover aspects you might not have considered and ensure that all relevant categories are included.
Review Historical Data
Look at past incidents or problems similar to the one you're analysing. Historical data can provide insights into which categories were relevant in those cases.
Be Open to Revision
As you delve deeper into the problem, you might find that some categories are too broad, too narrow, or simply not relevant. Be prepared to revise your categories as your understanding of the problem evolves.
Ensure Comprehensive Coverage
Your chosen categories should collectively cover all possible aspects of the problem. This thoroughness ensures that no potential root cause is overlooked.
By thoughtfully selecting and potentially customising your categories based on these considerations, you can set a solid foundation for a Fishbone Analysis that accurately identifies root causes and facilitates effective problem-solving.
Fishbone Diagram Example
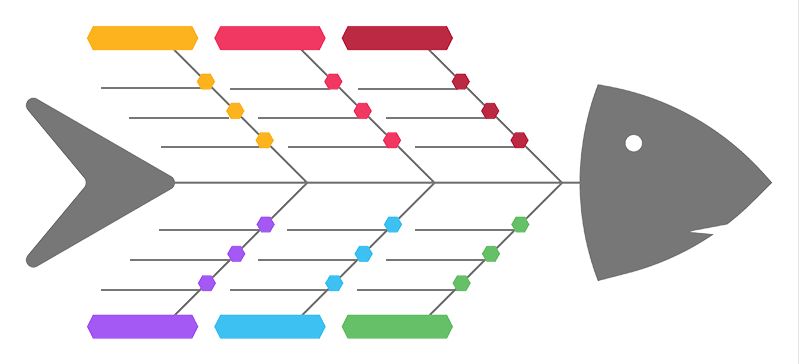
Download our Fishbone diagram.
The Benefits of a Fishbone Diagram
The Fishbone Diagram, or Cause and Effect Diagram, offers several benefits in problem-solving and root cause analysis. Here are the key benefits of using a Fishbone Diagram:
Identifies Root Causes
The primary benefit of a Fishbone Diagram is its ability to help teams systematically identify the root causes of an issue rather than just addressing the symptoms. This deeper understanding can lead to more effective and long-lasting solutions.
Promotes Team Collaboration
Creating a Fishbone Diagram is typically a team activity that encourages participation from all members. This collaborative approach ensures a diverse range of perspectives and expertise, leading to a more comprehensive analysis.
Enhances Problem Understanding
By visually mapping out the causes of a problem, the Fishbone Diagram helps teams understand the complexity of the problem and how various factors are interrelated. This enhanced understanding can facilitate more targeted interventions.
Organises Discussion
The structured format of the diagram helps keep discussions focused and organised. It ensures that the team considers all potential areas of concern, categorised under different "bones" of the fish, which can lead to a more thorough analysis.
Facilitates Communication
The visual nature of the diagram makes it an excellent tool for communicating the findings of the analysis to others, including stakeholders who were not involved in the creation process. It can help quickly bring others up to speed on what the team has discovered.
Encourages a Systematic Approach
The Fishbone Diagram enforces a systematic approach to problem-solving. It guides teams to consider all possible causes of a problem, rather than jumping to conclusions based on initial assumptions.
Versatile
Fishbone Diagrams are versatile and can be applied in a wide range of industries and for various types of problems, including but not limited to manufacturing, healthcare, marketing, and software development.
Prioritises Issues
By identifying and visually presenting all potential causes, teams can more easily prioritise issues based on their impact or the ease with which they can be addressed. This helps in allocating resources more effectively.
Fosters Creativity
The brainstorming process involved in creating the diagram can spark creativity among team members, leading to innovative solutions that may not have been considered otherwise.
Supports Continuous Improvement
The Fishbone Diagram is an excellent tool for quality improvement and continuous improvement processes. It helps organisations systematically analyse and eliminate the root causes of problems, leading to higher-quality products, services, and processes over time.
The Limitations of Ishikawa Fishbone Diagram
While the Ishikawa's Fishbone Diagram is a valuable tool for root cause analysis and problem-solving, it also has several limitations. Being aware of these limitations can help users apply the tool more effectively by compensating for its drawbacks or choosing complementary methods. Here are some of the main limitations:
Complexity with Large Data Sets
When dealing with a very complex problem that has many potential causes, the Fishbone Diagram can become cluttered and overwhelming. This complexity can make it difficult to identify and focus on the most significant causes.
Lacks Quantitative Analysis
The Fishbone Diagram is a qualitative tool that does not inherently incorporate quantitative analysis. This means it doesn't prioritise causes by impact or likelihood without additional methods, such as the Pareto Analysis.
Subjectivity
The process of identifying causes and categorising them under different "bones" can be highly subjective and influenced by the biases of the participants. This subjectivity may lead to overlooking critical causes or overemphasising less relevant ones.
Does Not Suggest Solutions
The diagram is focused on identifying causes, not on suggesting solutions or actions to address the root causes. Teams need to use additional problem-solving techniques to develop and implement solutions.
Potential Over-Simplification
There's a risk of oversimplifying the causes of complex problems, especially if the diagram is not detailed enough or if the team rushes through the brainstorming process.
Groupthink Risk
When created in a group setting, there's a risk of groupthink, where less vocal participants may agree with dominant ones without truly exploring all potential causes.
Time and Resource Intensive
For the Fishbone Diagram to be effective, it requires thorough brainstorming and analysis, which can be time-consuming and resource-intensive. This may not be practical in all situations, especially where quick decisions are needed.
Limited by Team's Knowledge
The effectiveness of the diagram is limited by the knowledge and experience of the team members involved. If key areas of expertise are missing from the team, important causes may be overlooked.
To mitigate these limitations, it's often beneficial to use the Fishbone Diagram in conjunction with other tools and methodologies. For example, combining it with quantitative data analysis, encouraging diverse team participation, and following up with action plans for prioritised causes can enhance its effectiveness. Additionally, ensuring a facilitator guides the process can help manage complexity and minimise biases.
Where to Learn More About Problem Management and Root Cause Analysis?
Our Problem Management & Root Cause Analysis Techniques Workshop will teach you which techniques are most useful for different types of problems and when it's appropriate to undertake root cause analysis. You will also identify barriers to effective problem solving and how to overcome them and information gathering techniques.
Final Notes on Ishikawa's Fishbone Diagram
To summarise, Fishbone Diagrams are visual tools used for identifying root causes of problems by categorising potential causes into various classifications. They are effective for team collaboration, enhancing understanding of complex issues, and systematically approaching problem-solving.
Common categories include Methods, Machines, People, Materials, Measurement, and Environment, but can be customised to fit specific situations. While useful, they have limitations such as potential for complexity with large data sets, subjectivity, and lack of quantitative analysis.
Final tip for creating Fishbone Diagram - Ensure diverse team participation. This brings different perspectives and expertise to the table, minimising biases and oversights, and enhancing the diagram's comprehensiveness and accuracy.